Market Reads Customer Insights & Segmentation
Your Best-Looking B2B Customers May Be Costing You the Most
Grouping B2B customers by size and industry puts profitable and loss-making accounts side by side. Costing each account shows where profit is made, where it leaks and how groups drift over time.
Overview
Most mid-sized B2B businesses sort their customers by company size and sector, because those fields already sit in the CRM and nobody disputes them. This analysis argues that the grouping itself matters less than what gets decided from it. Discount levels, service tiers, sales hours and marketing budget are usually allocated group by group, so two accounts with opposite economics end up treated alike for years. Work on mature industrial markets by Rangan, Moriarty and Swartz found that firmographic details rarely separate buyers well; the trade-off each buyer makes between price and service does. Activity-based costing studies, including the well-known Kanthal case, show a small share of customers generating over 100% of a supplier's profit while a minority destroys much of it, and later research traced such losses to heavy service demands, returns and discount-only buying. The piece also covers why managers so often struggle to use their segments, and why any grouping ages as customer needs shift. It is written for owners, commercial directors and finance leads who set prices and service levels by customer group.
The deck




What It Means
The useful test of any customer grouping is whether it changes what each group is charged and offered. That requires three pieces of information most segment lists lack: the full cost of each account after price concessions, help desk time and bespoke orders, what it will pay full price for, and the reasons it keeps ordering. Accounts that score well on all three deserve protection and investment. Accounts that look large but cost more than they return need repricing or a service tier that covers its own cost, rather than another year of the same plan. Because needs change, the grouping should be refreshed on a set cycle rather than treated as a one-off project. This is the work behind our customer insights and segmentation practice: costing every account, ranking groups by value and agreeing terms, service and sales effort for each one.
Common Questions
What is customer segmentation analysis?
Customer segmentation analysis divides a customer base into groups that differ enough to justify different treatment. In B2B it often starts with headcount and sector, but stronger groupings also use what each account costs to keep, what buyers value and how they buy. The aim is a set of groups that each warrant their own pricing, service tier and sales effort, rather than a list that is presented once and filed.
What are the main bases of segmentation in B2B?
Common bases include firmographics such as size, sector and location; the needs and benefits buyers look for; purchasing behaviour such as order size and frequency; how decisions are made inside the account; and profitability. Firmographics are the easiest to collect, which is why many segmentations stop there, yet profitability and needs usually explain far more about how each account should be served and priced.
Why are some large customers unprofitable?
Size can hide the cost of keeping an account. Large buyers often negotiate deeper discounts, ask for custom work, pay late or need more support, and none of this appears in revenue figures. Activity-based costing studies repeatedly find that a minority of customers absorbs a large share of profit, which is why each account should be costed before it is treated as a model for the rest.
Transcript
Two customers your segment treats as one
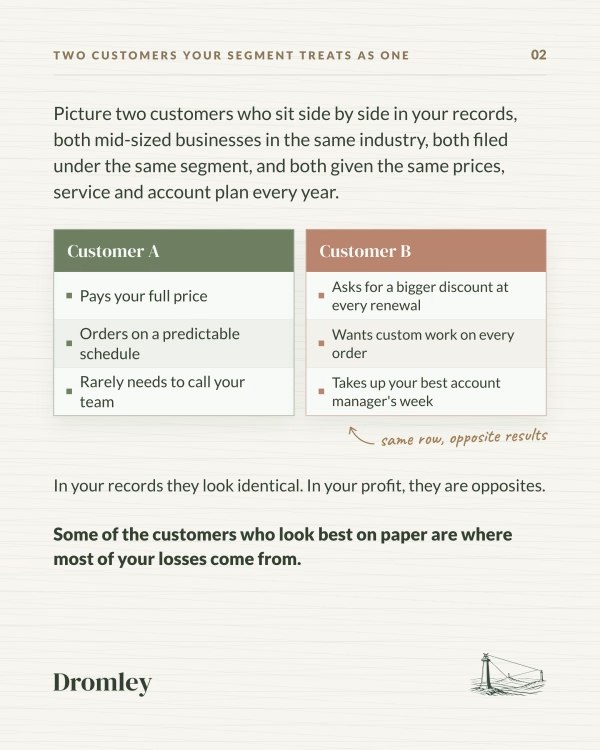
Picture two customers who sit side by side in your records, both mid-sized businesses in the same industry, both filed under the same segment, and both given the same prices, service and account plan every year.
Customer A
Pays your full price
Orders on a predictable schedule
Rarely needs to call your team
Customer B
Asks for a bigger discount at every renewal
Wants custom work on every order
Takes up your best account manager's week
same row, opposite results
In your records they look identical. In your profit, they are opposites.
Some of the customers who look best on paper are where most of your losses come from.
What your segments decide about your spending
The list of segments costs almost nothing to make. What costs real money is everything decided from it, because most businesses set their spending one segment at a time, quarter after quarter.
Decided by segment
set once, spent every quarter
How much discount a customer gets
What level of service they receive
How much of your sales team's time they get
How much marketing budget they get
Put a profitable customer and a loss-making one in the same group, and both get the same discount, the same service and the same hours from your team.
You end up paying to serve customers who look like your best ones but aren't.
Why size and industry are not enough
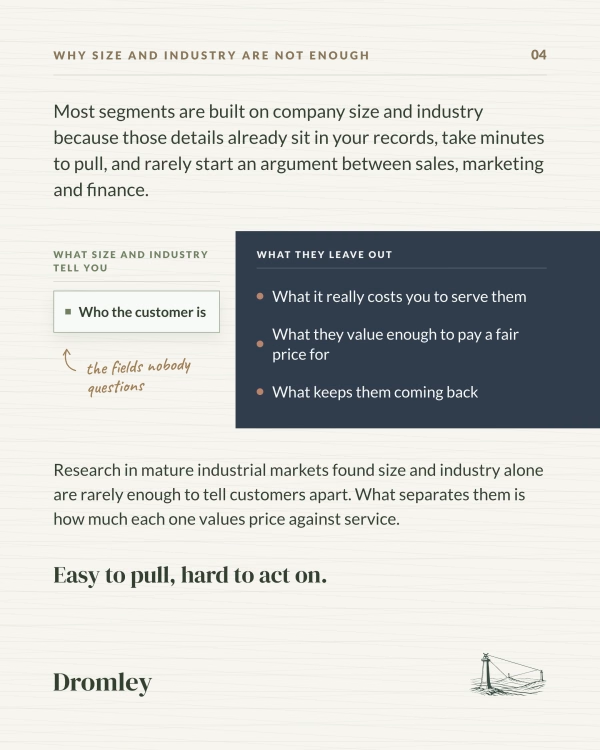
Most segments are built on company size and industry because those details already sit in your records, take minutes to pull, and rarely start an argument between sales, marketing and finance.
What size and industry tell you
Who the customer is
the fields nobody questions
What they leave out
What it really costs you to serve them
What they value enough to pay a fair price for
What keeps them coming back
Research in mature industrial markets found size and industry alone are rarely enough to tell customers apart. What separates them is how much each one values price against service.
Easy to pull, hard to act on.
Why most managers can't act on their segments
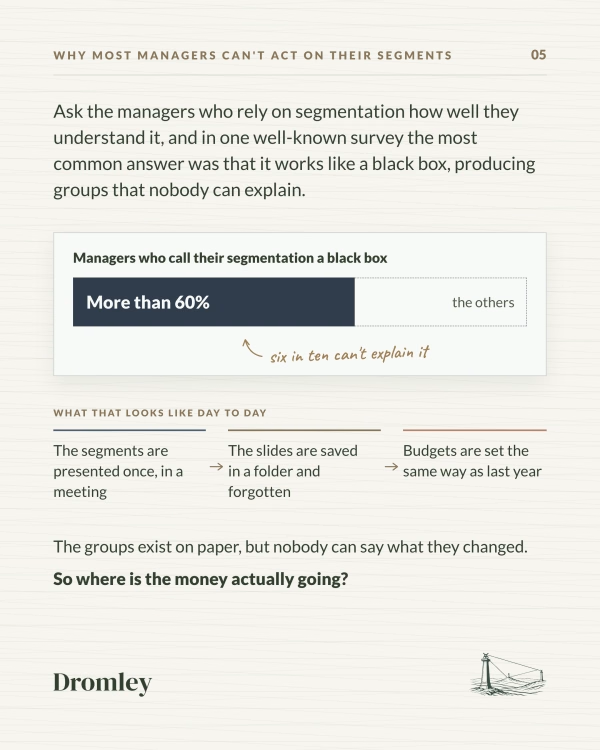
Ask the managers who rely on segmentation how well they understand it, and in one well-known survey the most common answer was that it works like a black box, producing groups that nobody can explain.
Managers who call their segmentation a black box
More than 60%
the others
six in ten can't explain it
What that looks like day to day
The segments are presented once, in a meeting
The slides are saved in a folder and forgotten
Budgets are set the same way as last year
The groups exist on paper, but nobody can say what they changed.
So where is the money actually going?
Where the profit comes from
One industrial manufacturer worked out the true cost of serving each customer, counting discounts, support and special orders, and the result looked nothing like its sales report.
Share of total profit, by customer group
Top 20% · 225%
a fifth earns more than all of it
Middle 70% · about zero
Bottom 10% · a 125% loss
Its largest customer, seen as the most important, was the least profitable of all.
a tenth wipes out more than the total
Over 100%, because the bottom group's losses cancel part of it
A later study of five more firms found the same pattern, and traced most losses to three habits.
Needing far more help and service
Returning much of what they buy
Buying only on discount
None of these shows up in a segment built on size.
Why customer segments go out of date
Even a well built segment has a shelf life. What a customer needs from you rarely stays still for long, and most businesses redraw their groups far less often than their customers actually change.
Two years ago
Needed fast delivery above everything else
Happily paid extra for priority service
Today
Mostly wants the lowest price
Asks competitors for quotes at every renewal
drawn once, never redrawn
When customers were tracked over two years in a consumer study, about half had moved into a different segment, while the plans built on the old groups kept running.
Same company, same segment, different customer.
What a segment that pays its way looks like
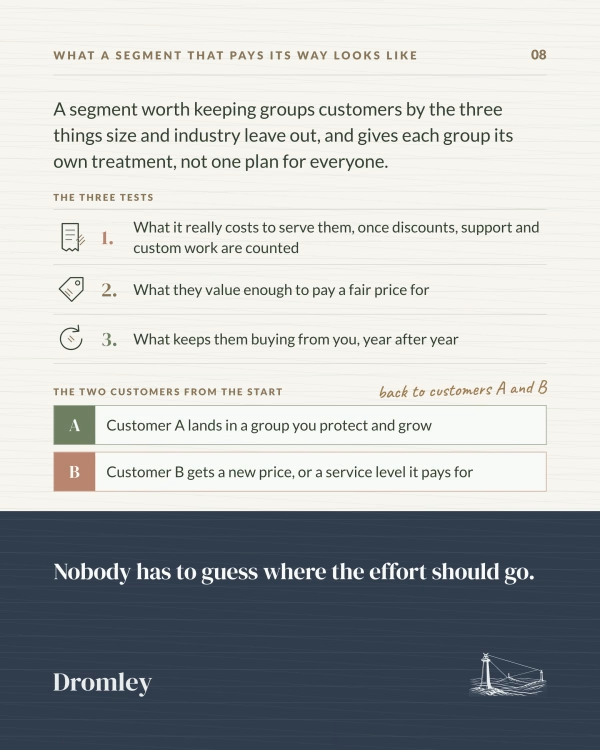
A segment worth keeping groups customers by the three things size and industry leave out, and gives each group its own treatment, not one plan for everyone.
The three tests
1. What it really costs to serve them, once discounts, support and custom work are counted
2. What they value enough to pay a fair price for
3. What keeps them buying from you, year after year
The two customers from the start
back to customers A and B
A Customer A lands in a group you protect and grow
B Customer B gets a new price, or a service level it pays for
Nobody has to guess where the effort should go.
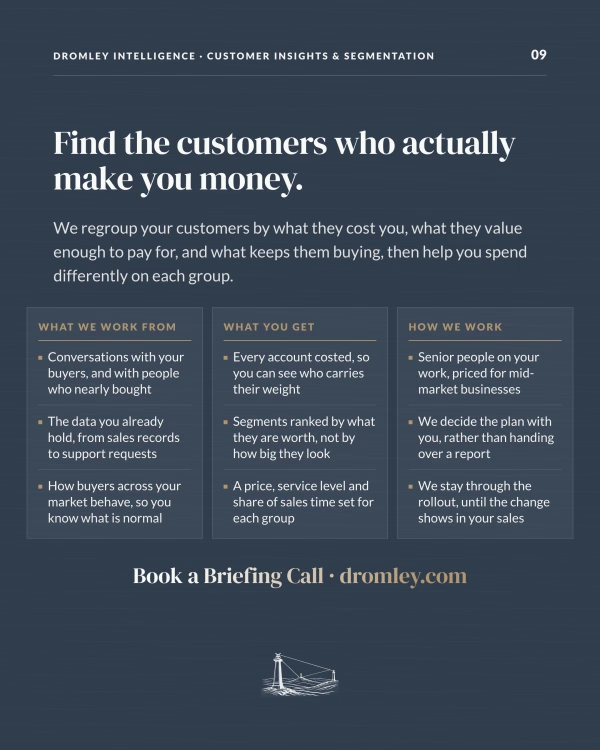
Dromley Intelligence · Customer Insights & Segmentation
Find the customers who actually make you money.
We regroup your customers by what they cost you, what they value enough to pay for, and what keeps them buying, then help you spend differently on each group.
What we work from
Conversations with your buyers, and with people who nearly bought
The data you already hold, from sales records to support requests
How buyers across your market behave, so you know what is normal
What you get
Every account costed, so you can see who carries their weight
Segments ranked by what they are worth, not by how big they look
A price, service level and share of sales time set for each group
How we work
Senior people on your work, priced for mid-market businesses
We decide the plan with you, rather than handing over a report
We stay through the rollout, until the change shows in your sales
Book a Briefing Call · dromley.com
Sources & Further Reading
- Segmenting Customers in Mature Industrial Markets, Journal of Marketing (1992). Rangan, Moriarty and Swartz
- Unprofitable Cross-Buying: Evidence from Consumer and Business Markets, Journal of Marketing (2012). Shah et al.
- Cost-to-serve measurement and customer profitability analysis, The International Journal of Logistics Management (2008). Guerreiro, Bio and Merschmann
- Methodological reasons for the theory/practice divide in market segmentation, Journal of Marketing Management (2009). Dolnicar and Lazarevski
- Stability of membership in market segments identified with a disaggregate consumption model, Journal of Business Research (1987). Farley, Winer and Lehmann
Decks are easy. Decisions are not.
Bring us the real question. We’ll come back with how we’d approach it. Not a brochure. A starting point.
Book a Briefing Call