Market Reads Customer Insights & Segmentation
Customer Retention Rate: Is Revenue Keeping Up With It?
A retention rate counts the customers who stayed, not what they spend. The analysis shows how revenue can slip behind a steady rate, and which figure brings that loss into view.
Overview
Customer retention rate measures the proportion of customers still buying when a period closes. It does not measure what they spend, and that is the gap this analysis examines. Because the rate counts accounts rather than money, a business can keep almost every customer while earning noticeably less from them, as buyers order less often, place smaller orders or stop using some product lines. In a two year study of 1,200 households across 16 industries, Coyles and Gokey found that managing smaller changes in customer spending could be worth up to ten times more than preventing defections alone. A study of more than 126,000 customers of one online retailer found that the extra value of returning customers came mainly from how often they bought, not from larger orders. The piece then sets out net revenue retention, which compares what an existing group of customers spends this year with what it spent last year, and examines published benchmarks, which mostly come from subscription software firms and sit closer to 100% than many guides imply. It closes with questions any business can answer from its own sales records, and is written for owners, finance leads and commercial directors.
The deck





What It Means
A steady retention figure says little about whether existing customers are worth as much as they were, so the first step is to put a money figure beside it. Take last year's customers, total what they spent in each of the two years, and treat anyone who has gone as spending nothing. Then list the accounts whose spending has fallen for two quarters running and ask what changed for each one: order frequency, order size or the range of products bought. That list usually explains more of the revenue gap than the customers who left, and it is where a customer churn analysis should begin. This is the starting point for our customer insights work, which reads sales records one customer at a time to show which accounts are slipping and which are worth defending first.
Common Questions
What is a good customer retention rate?
There is no single good figure, because the rate ignores spending. A rate of 90% only says that nine in ten customers are still buying. If those customers order less often or buy fewer products, revenue from the same group can fall well below 90% of last year. Read the rate alongside net revenue retention, which measures the same customers in money, before deciding whether the figure is healthy.
What is the difference between gross and net revenue retention?
Both compare what an existing group of customers spends now with what it spent before. Gross revenue retention counts only losses, from customers who leave or spend less, so it cannot exceed 100%. Net revenue retention also adds any growth from customers who spend more. A large gap between the two shows that growth in some accounts is masking losses in others.
What is a good net revenue retention rate?
Published figures come mostly from subscription software. SaaS Capital's 2025 survey of private B2B software companies put the median at 101%, lower than the 110% to 120% often described as strong. Firms that sell on a per order or project basis have no comparable public benchmark, so the most useful comparison is usually their own figure over several years.
Transcript
Customer retention rate is the share of customers you started the year with who are still buying from you at the end of it, and it is usually the first figure a business reports.
Spend never enters the sum.
What it is: customers kept, divided by customers you started with. Keep 90 of 100 and the rate reads 90%.
What it is not: a measure of money. One small order and a weekly buyer each count once.
Why it matters: targets and plans lean on this one figure, so whatever it cannot see goes unseen.
What do kept customers spend?
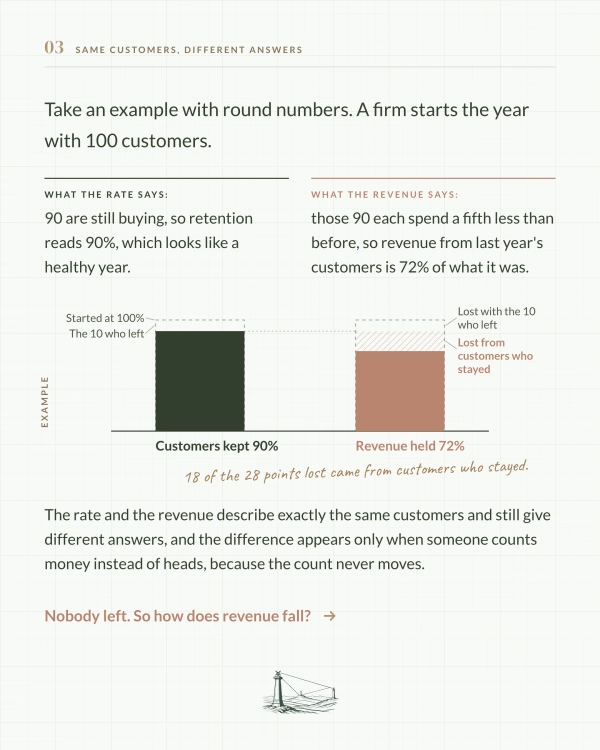
Take an example with round numbers. A firm starts the year with 100 customers.
What the rate says: 90 are still buying, so retention reads 90%, which looks like a healthy year.
What the revenue says: those 90 each spend a fifth less than before, so revenue from last year's customers is 72% of what it was.
18 of the 28 points lost came from customers who stayed.
The rate and the revenue describe exactly the same customers and still give different answers, and the difference appears only when someone counts money instead of heads, because the count never moves.
Nobody left. So how does revenue fall?
A customer can shrink in three different ways without ever leaving, and because the retention rate only counts heads, it cannot see any of them happening.
Alive on paper.
Fewer orders: a customer who bought monthly now buys every quarter, so the account looks alive while the revenue thins.
Smaller orders: the same number of purchases, but each covers less, sometimes because a rival has taken part of the work.
Narrower range: the customer still buys, but from two of your five product lines, and the other three go quiet.
None of it registers. One number would.
How much of last year's revenue do you still have?
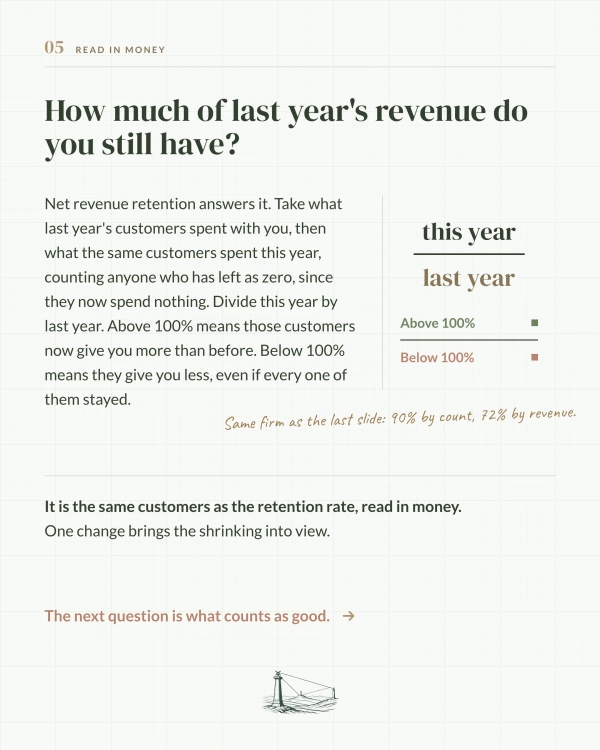
Net revenue retention answers it. Take what last year's customers spent with you, then what the same customers spent this year, counting anyone who has left as zero, since they now spend nothing. Divide this year by last year. Above 100% means those customers now give you more than before. Below 100% means they give you less, even if every one of them stayed.
Same firm as the last slide: 90% by count, 72% by revenue.
It is the same customers as the retention rate, read in money. One change brings the shrinking into view.
The next question is what counts as good.
Guides often call 110% to 120% good. That range comes from subscription businesses, where customers pay every month and add to their plan as they grow. Even among private B2B subscription businesses, the middle of the pack sits near 101%, well short of what the guides suggest.
The limit matters.
A firm that sells by order or by project has no equivalent yardstick of its own, so a published benchmark is a rough guide at best, and perhaps a misleading one for its own numbers.
So what counts as good for a firm that sells differently?
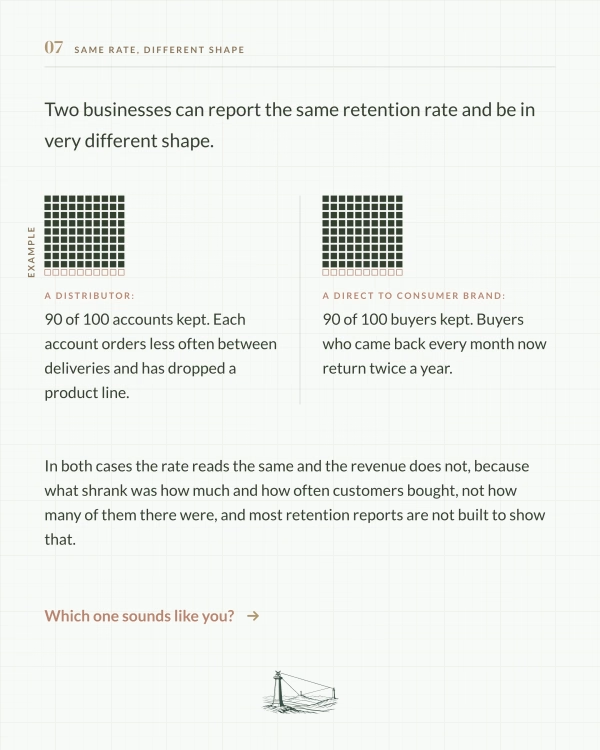
Two businesses can report the same retention rate and be in very different shape.
A distributor: 90 of 100 accounts kept. Each account orders less often between deliveries and has dropped a product line.
A direct to consumer brand: 90 of 100 buyers kept. Buyers who came back every month now return twice a year.
In both cases the rate reads the same and the revenue does not, because what shrank was how much and how often customers bought, not how many of them there were, and most retention reports are not built to show that.
Which one sounds like you?
These five questions can be answered from records most firms already hold, and each one that gets a no marks a place where the retention rate is steering the business on its own.
Count the no answers.
Can you say how many of last year's customers bought less this year?
Do you know what last year's customers spent in total, this year against last?
Does any target measure revenue from existing customers?
Could you name the accounts whose orders have shrunk for two quarters in a row?
Would falling spend show in your reports before a customer left?
Several no answers mean the rate is steering alone.
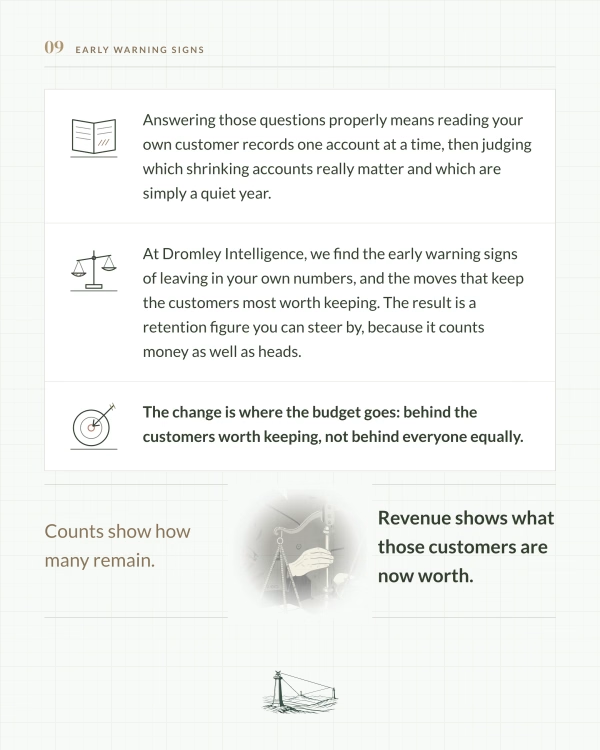
Answering those questions properly means reading your own customer records one account at a time, then judging which shrinking accounts really matter and which are simply a quiet year.
At Dromley Intelligence, we find the early warning signs of leaving in your own numbers, and the moves that keep the customers most worth keeping. The result is a retention figure you can steer by, because it counts money as well as heads.
The change is where the budget goes: behind the customers worth keeping, not behind everyone equally.
Counts show how many remain. Revenue shows what those customers are now worth.
Sources & Further Reading
- What is a Good Retention Rate for a Private SaaS Company in 2025?, SaaS Capital (2025). SaaS Capital
- How to Keep Them Coming Back: Lessons for SMEs Focused on Growth and Sustainability, Journal of Small Business Strategy (2026). Black et al.
- Customer retention is not enough, Journal of Consumer Marketing (2005). Coyles and Gokey
Decks are easy. Decisions are not.
Bring us the real question. We’ll come back with how we’d approach it. Not a brochure. A starting point.
Book a Briefing Call