Market Reads Growth & Revenue Marketing
Marketing Attribution Model Accuracy & Deal Volume in B2B
Attribution figures look equally precise whether they rest on a few dozen sales or several thousand. The analysis explains why deal volume decides whether a channel ranking can be trusted.
Overview
In B2B marketing attribution, channel rankings from software are often treated as settled facts when budgets are set. This analysis asks a prior question: how many completed sales sit underneath them. Attribution models look for patterns in the steps that come before a purchase, and like any statistical estimate they need many cases before a pattern can be told apart from chance. Google's guidance for its data driven model recommends at least 200 conversions and 2,000 ad interactions, but a conversion there usually means an enquiry or a form, not a signed order. For a business whose enquiries turn into sales at low single digit rates, the deals behind the report may number only a handful each month. Research on measuring advertising returns shows how wide the uncertainty can be: across 25 large field experiments, Lewis and Rao found the median confidence interval on return on investment was more than 100 percentage points wide. The piece also covers the second hidden choice, the rule used to divide credit between channels, and offers practical steps for firms with low deal volumes. It is written for owners, finance leads and heads of marketing.
The deck




What It Means
Before acting on a channel ranking, ask how many closed and paid sales it was built from, and write that number on the report. If it is small, a shift in the ranking from one quarter to the next is more likely to reflect the particular deals that closed than any change in buyer behaviour. In that case, fewer channels running at once, a short question to every new customer about how they came to choose you, and a credit rule agreed before results arrive will usually tell you more than a more advanced model. This is part of how our marketing channel attribution work starts: by establishing whether the data behind a report can carry the decision being asked of it.
Common Questions
What is a data driven attribution model?
A data driven attribution model is a method that shares credit for a conversion across the ads and channels a buyer interacted with, based on patterns in an account's own history rather than a fixed rule such as last click. Because it learns from past conversions, its reliability depends on volume. Google recommends a minimum number of conversions and ad interactions before the model is used.
How many conversions do you need for attribution to be reliable?
There is no single number, but platform guidance gives a floor: Google recommends at least 200 conversions and 2,000 ad interactions for its data driven model. Those conversions are usually enquiries, not sales. A business that closes only a small share of enquiries will have far fewer completed deals behind the figures, which makes rankings between channels much less stable.
What are the main marketing attribution models?
Common approaches are first touch, which credits the first recorded interaction; last touch, which credits the final one; linear, which splits credit equally across every step; and data driven, which assigns credit using patterns in past conversions. Each can produce a different winner from the same sales, so the choice of model shapes the result as much as the data does.
Transcript
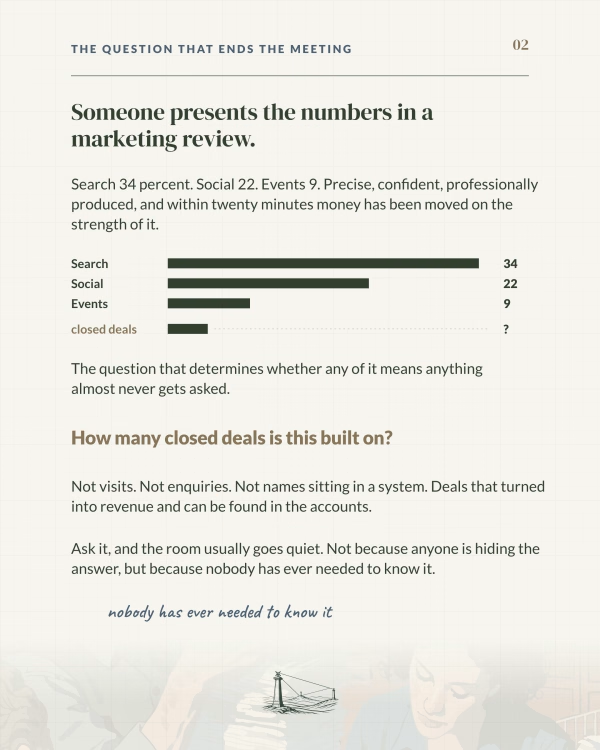
Someone presents the numbers in a marketing review.
Search 34 percent. Social 22. Events 9. Precise, confident, professionally produced, and within twenty minutes money has been moved on the strength of it.
The question that determines whether any of it means anything almost never gets asked.
How many closed deals is this built on?
Not visits. Not enquiries. Not names sitting in a system. Deals that turned into revenue and can be found in the accounts.
Ask it, and the room usually goes quiet. Not because anyone is hiding the answer, but because nobody has ever needed to know it.
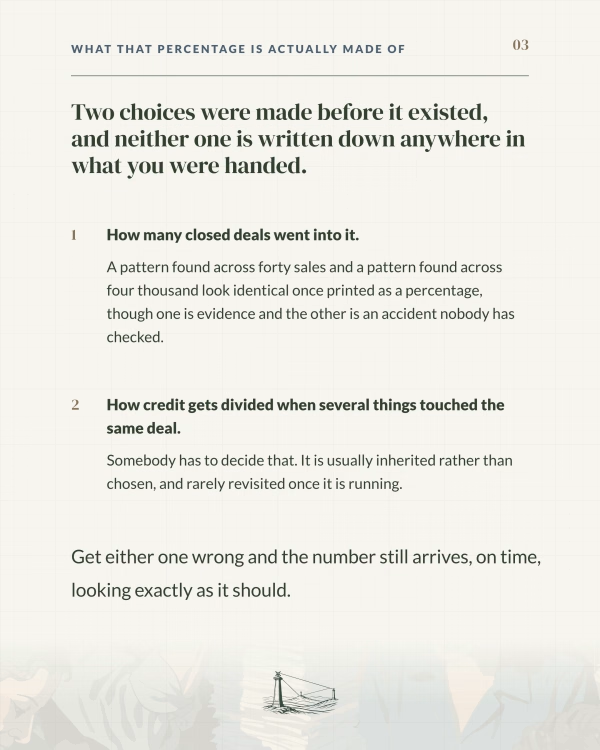
Two choices were made before it existed, and neither one is written down anywhere in what you were handed.
First: how many closed deals went into it. A pattern found across forty sales and a pattern found across four thousand look identical once printed as a percentage, though one is evidence and the other is an accident nobody has checked.
Second: how credit gets divided when several things touched the same deal. Somebody has to decide that. It is usually inherited rather than chosen, and rarely revisited once it is running.
Get either one wrong and the number still arrives, on time, looking exactly as it should.
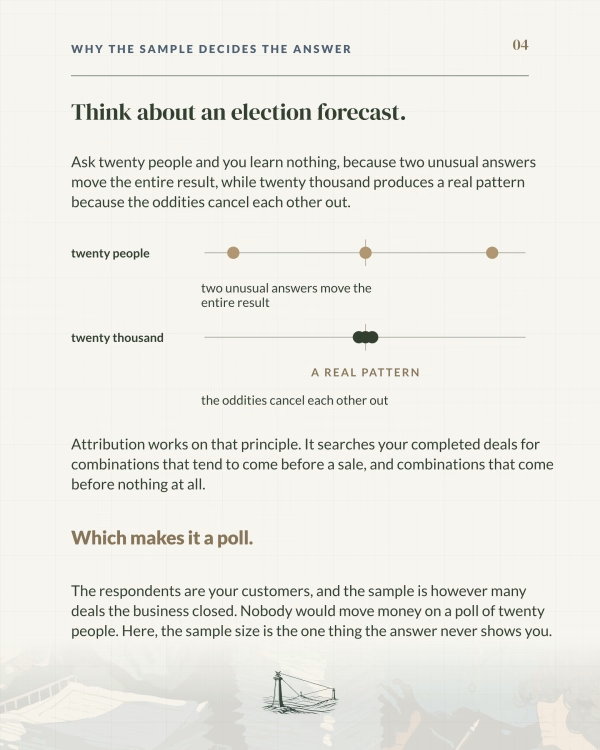
Think about an election forecast.
Ask twenty people and you learn nothing, because two unusual answers move the entire result, while twenty thousand produces a real pattern because the oddities cancel each other out.
Attribution works on that principle. It searches your completed deals for combinations that tend to come before a sale, and combinations that come before nothing at all.
Which makes it a poll.
The respondents are your customers, and the sample is however many deals the business closed. Nobody would move money on a poll of twenty people. Here, the sample size is the one thing the answer never shows you.
The platforms that run these models publish what they need.
The figure sits at a couple of hundred enquiries a month. Every month, without a gap.
That word conversion is doing a great deal of work. It means an enquiry. A form completed, a call booked, a document downloaded. It does not mean a sale.
Now apply a rate most considered purchases would recognise. Somewhere around 3%.
200 enquiries a month, at 3%, is 6 closed deals.
So the volume the method needs in order to find a pattern is enquiries. The thing the business actually runs on arrives six at a time.
Here is what makes this so difficult to catch.
Nothing about the answer changes when the evidence behind it is thin. Same shape, same point in the month, same wording, whether it was worked out from forty sales or four thousand. And the volume it rests on is not printed anywhere on it.
So the question never gets asked.
The team presenting the number is also the team it assesses. And the person with the authority to demand the sample size is usually the one least equipped to know it is missing.
So it goes through. The next plan gets built on top of it.
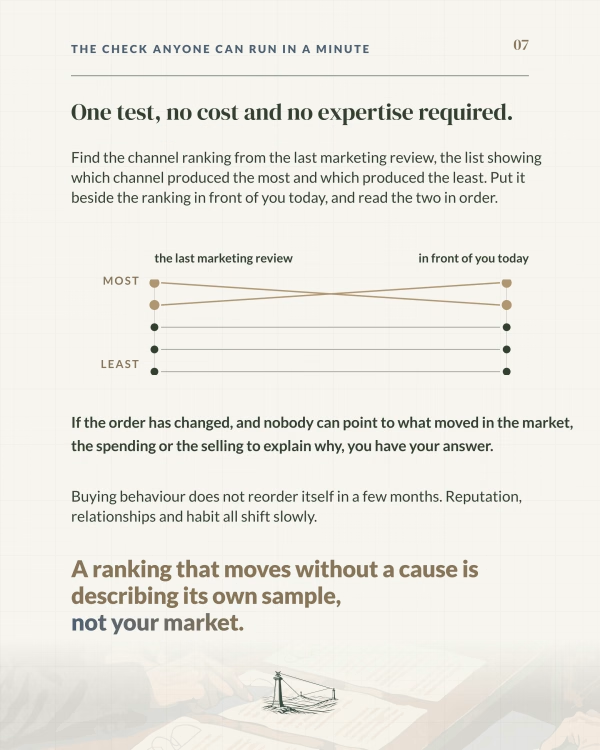
One test, no cost and no expertise required.
Find the channel ranking from the last marketing review, the list showing which channel produced the most and which produced the least. Put it beside the ranking in front of you today, and read the two in order.
If the order has changed, and nobody can point to what moved in the market, the spending or the selling to explain why, you have your answer.
Buying behaviour does not reorder itself in a few months. Reputation, relationships and habit all shift slowly.
A ranking that moves without a cause is describing its own sample, not your market.
Now the second choice, the one flagged earlier.
It stays untouched for years.
Credit the last thing that happened before a deal, and the teams closest to the sale look like the engine of the business. Credit the first, and the work that built the relationship triples. Same year, same customers, same money. Only the rule moved.
So two teams can each be called your strongest performer, honestly, from the same deals.
That rule is rarely set by anyone neutral, and once a number is winning somebody their budget, nobody in the building has a reason to question how it was built.
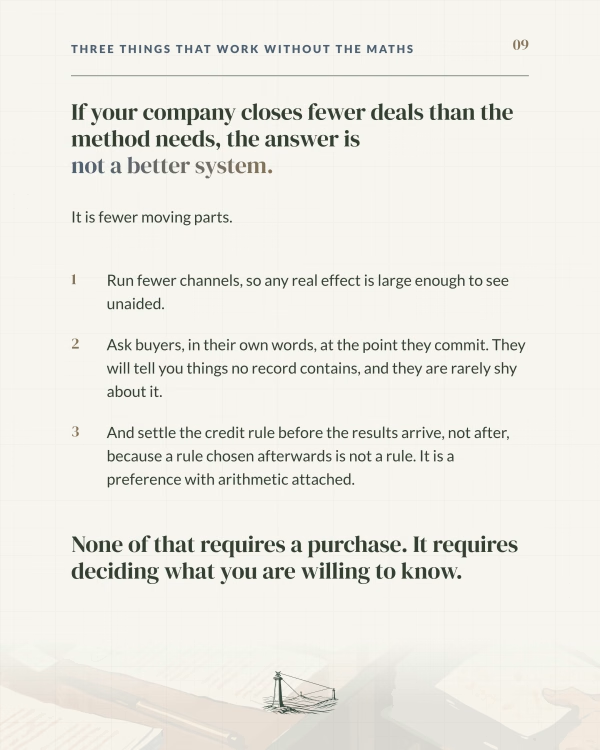
If your company closes fewer deals than the method needs, the answer is not a better system.
It is fewer moving parts.
Run fewer channels, so any real effect is large enough to see unaided.
Ask buyers, in their own words, at the point they commit. They will tell you things no record contains, and they are rarely shy about it.
And settle the credit rule before the results arrive, not after, because a rule chosen afterwards is not a rule. It is a preference with arithmetic attached.
None of that requires a purchase. It requires deciding what you are willing to know.
Sources & Further Reading
- About data-driven attribution, Google Ads Help (2026). Google
- The Unfavorable Economics of Measuring the Returns to Advertising, The Quarterly Journal of Economics (2015). Lewis and Rao
- Close Enough? A Large-Scale Exploration of Non-Experimental Approaches to Advertising Measurement, Marketing Science (2023). Gordon, Moakler and Zettelmeyer
Decks are easy. Decisions are not.
Bring us the real question. We’ll come back with how we’d approach it. Not a brochure. A starting point.
Book a Briefing Call